Over the last 40 years, obesity has become an American epidemic, one to which we can correlate any number of changes and trends. Here are two sets of infographics from two very different sources that reflect some of those changes and trends.
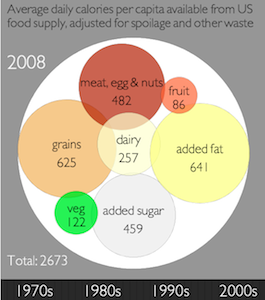
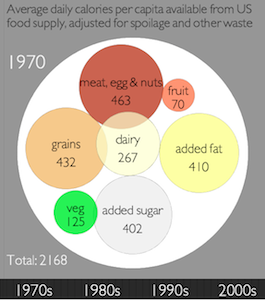
For example, from Civil Eats, in partnership with the UC Berkeley Graduate School of Journalism, we get an illustration of the rising calorie intake between 1970 and 2008.
Between 1970 and 1980, calorie intake is relatively stable, rising only 1.2%. Between 1980 and 1990 consumption jumped 9.6%. Then, from 1990 to 2008, the last year with data available, the number of calories rises another 11.4% for a grand total of 2,673 calories available per person – 23.3% more than consumed in 1970.
View an interactive version of these graphics here.
Clearly the increased calorie intake has had a big influence on American’s waistlines.
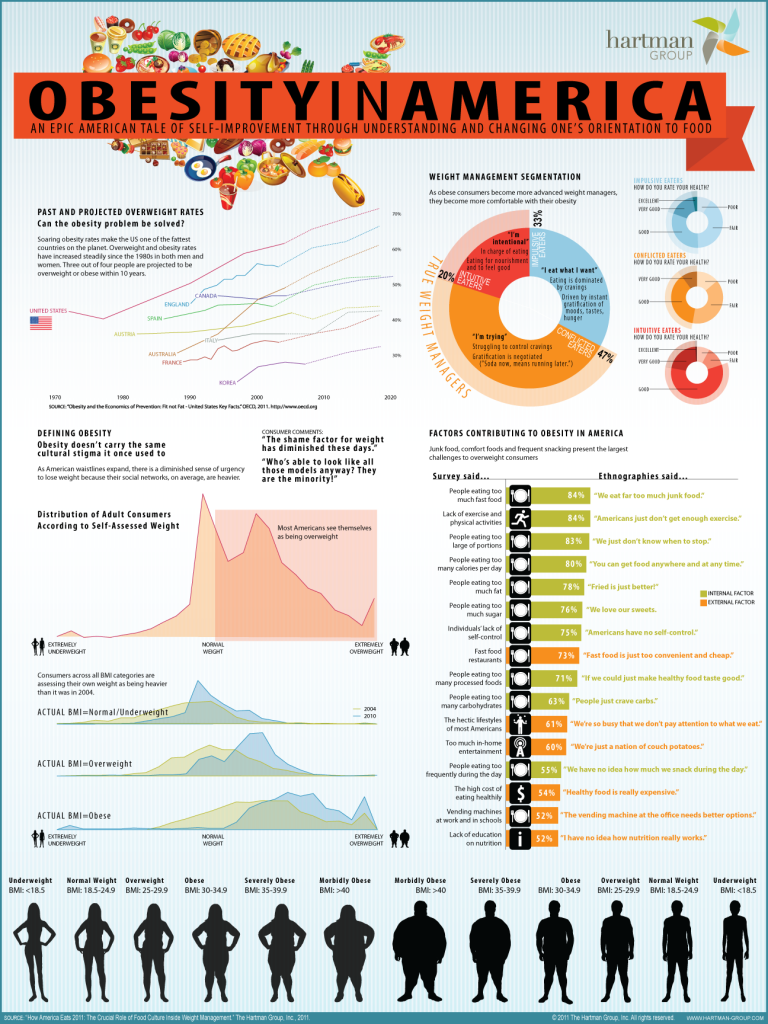
Soaring obesity rates make the US one of the fattest countries on the planet. Overweight and obesity rates have increased steadily since the 1980s in both men and women. Three out of four people are projected to be overweight or obese within 10 years.
The Hartman Group, a consumer research firm in Seattle, has created a slightly different – but related – infographic that shows how Americans assess their own weight, how they think about obesity and their own health, and what the factors are that are causing obesity today.
(Click on the image to see a full sized version.)


